free tools site for ever

Historical Inflation Calculator (U.S. CPI)
When was the last time you wondered what your grandparents paid for a gallon of milk in 1970? Or perhaps you're curious about how much your parents' first home would cost in today's dollars? Understanding the value of money over time in the USA isn't just a fascinating historical exercise—it's an essential financial literacy skill.
5/1/202510 min read
Historical Inflation Calculator (U.S. CPI)
Introduction
When was the last time you wondered what your grandparents paid for a gallon of milk in 1970? Or perhaps you're curious about how much your parents' first home would cost in today's dollars? Understanding the value of money over time in the USA isn't just a fascinating historical exercise—it's an essential financial literacy skill.
Welcome to our comprehensive guide on historical inflation calculation. In this article, we'll explore the powerful tool known as a historical inflation calculator and how it helps us understand the changing value of the U.S. dollar through decades. Whether you're a student researching economic trends, a professional adjusting contracts for inflation, or simply curious about how the dollar value over time has changed, this guide will provide valuable insights.
The consumer price index (CPI), the foundation of any reliable US inflation calculator by year, tells an important story about our economy. By tracking the cost of a basket of goods and services over time, the CPI provides a window into how inflation erodes purchasing power. Our adjust for inflation calculator helps translate these abstract concepts into practical, real-world terms.
From the stagflation of the 1970s to the recent inflation surges, understanding how to calculate past dollar value gives us perspective on economic history and helps inform future financial decisions. Join us as we dive into the fascinating world of inflation measurement, explore how to use inflation rate calculators effectively, and discover what these numbers mean for everyday Americans.
Understanding Inflation and the Consumer Price Index
Inflation might seem like just another economic buzzword thrown around on financial news channels, but its impact on your wallet is very real. So what exactly is this invisible force that steadily chips away at your purchasing power?
What is Inflation and Why Does It Matter?
In simple terms, inflation is the rate at which the general level of prices for goods and services rises, causing purchasing power to fall over time. Think about it—the $20 bill in your wallet today buys significantly less than it did in 1990 or even 2010. This isn't because the physical bill changed, but because the value of money over time in the USA has diminished.
Why should you care? Because inflation affects virtually every financial decision you make:
Your savings might be growing in nominal terms but shrinking in real value
Your salary increases need to outpace inflation just to maintain purchasing power
Long-term financial planning becomes meaningless without accounting for inflation
Investment returns must be evaluated in inflation-adjusted terms
For example, if you saved $10,000 in 2000 and kept it under your mattress until today, you'd still have $10,000—but its purchasing power would have decreased dramatically. This is why understanding and calculating inflation is crucial for sound financial planning.
The Consumer Price Index (CPI) Explained
The Consumer Price Index (CPI) serves as the primary tool for measuring inflation in the United States. But what exactly is this index, and how does it work?
The CPI is essentially a massive shopping list. The Bureau of Labor Statistics (BLS) tracks the prices of approximately 80,000 consumer items each month, from milk and bread to housing and healthcare services. These items, collectively known as the "market basket," represent typical American spending patterns.
When you use a CPI inflation calculator USA, you're tapping into this extensive database of historical price changes. The index is calculated using a base period (currently 1982-1984 = 100), meaning that prices are expressed relative to this baseline.
The formula looks deceptively simple: CPI = (Cost of market basket in given year / Cost of same market basket in base period) × 100
However, the complexity lies in collecting accurate price data and maintaining a representative basket over time. As consumer preferences evolve (think smartphones replacing landlines), the BLS periodically updates the composition of this basket.
How the Bureau of Labor Statistics Measures Inflation
The process of measuring inflation is both an art and a science. The BLS employs hundreds of data collectors who visit thousands of retail stores, service establishments, rental units, and doctor's offices to gather approximately 80,000 prices monthly.
This massive data collection effort spans:
Urban areas across the country (representing about 93% of the total U.S. population)
Different types of outlets (from supermarkets to online retailers)
Various consumer categories (food, housing, apparel, transportation, medical care, recreation, education, and more)
When using a historical inflation calculator, you're benefiting from this meticulous tracking system that's been refined over decades. The BLS uses sophisticated sampling techniques to ensure the data accurately represents consumer spending patterns and price changes across the nation.
Interestingly, the BLS calculates several versions of the CPI, including:
CPI-U: For all urban consumers (most widely used)
CPI-W: For urban wage earners and clerical workers (used for Social Security adjustments)
Core CPI: Excludes volatile food and energy prices (used by economists to identify underlying trends)
Historical Trends in U.S. Inflation
Looking at inflation through a historical lens reveals fascinating patterns that reflect America's economic journey. The dollar value over time calculator shows dramatic variations in inflation rates that coincide with major economic events.
The 20th century began with modest inflation, but World War I brought significant price increases followed by deflation in the early 1920s. The Great Depression saw severe deflation, with prices falling about 24% between 1929 and 1933—a phenomenon nearly as destructive as high inflation.
Post-World War II, the U.S. experienced relatively stable inflation until the 1970s, when we witnessed the most significant sustained inflation in modern American history. Using a 1970 to 2025 inflation calculator reveals that the dollar lost substantial value during this period, with annual inflation rates reaching as high as 13.5% in 1980.
The early 1980s marked a turning point when Federal Reserve Chairman Paul Volcker raised interest rates dramatically to combat inflation. This led to a recession but successfully broke the inflationary spiral. Since then, inflation has generally remained lower and more stable, typically averaging around 2-3% annually—though with occasional spikes during economic crises or unusual circumstances like the post-pandemic period.
Understanding these patterns helps contextualize the numbers you see when using an adjust for inflation calculator and provides valuable perspective on current economic conditions. By studying historical inflation trends, economists and policymakers gain insights that help guide monetary policy decisions that affect us all.
Using Historical Inflation Calculators
Benefits of Using an Inflation Calculator
Historical inflation calculators transform abstract economic concepts into practical, applicable information. These tools allow you to:
Convert past dollar amounts into current equivalent values
Compare purchasing power across different time periods
Make informed decisions about long-term investments
Understand the real cost of goods and services over time
Evaluate economic policies by their inflation impacts
Whether you're researching family history, analyzing business trends, or planning for retirement, a US inflation calculator by year provides crucial context for financial figures across different eras.
Types of Historical Inflation Calculators Available
Not all inflation calculators are created equal. Various tools serve different purposes:
Basic inflation calculators: Convert values between two specific years
Comprehensive historical calculators: Show year-by-year inflation progression
Specialized calculators: Focus on specific regions or economic sectors
Interactive visualizations: Display inflation trends graphically over time
Advanced calculators: Incorporate additional economic indicators
Each type offers unique insights into how the dollar value over time has changed, with varying levels of detail and complexity.
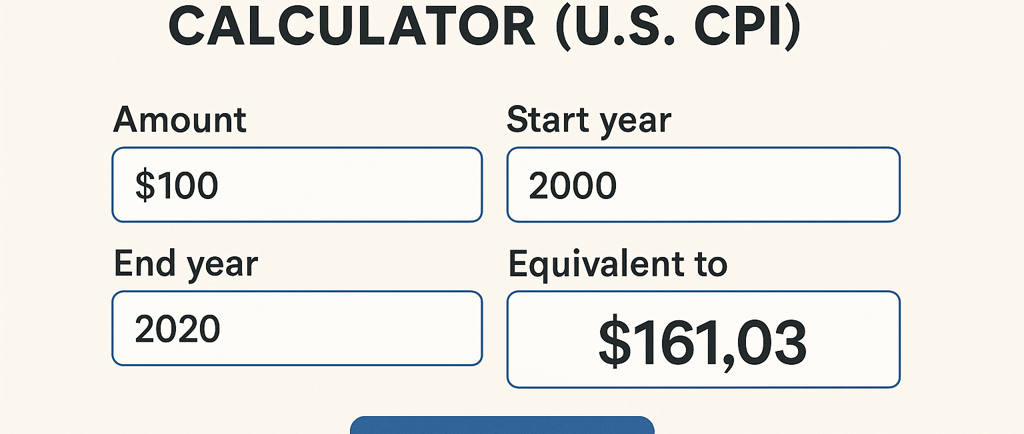
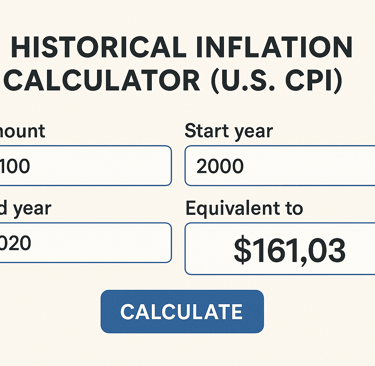
Step-by-Step Guide to Using Our Calculator
Our CPI inflation calculator USA is designed to be intuitive and user-friendly:
Enter the initial dollar amount you want to convert
Select the starting year (when the money was spent or received)
Choose the target year (when you want to know the equivalent value)
Click "Calculate" to see the inflation-adjusted result
Review additional data points like cumulative inflation rate and average annual inflation
For example, entering $10,000 from 1980 might show an equivalent value of over $35,000 today—revealing how significantly purchasing power has changed over four decades.
Common Use Cases for Inflation Calculations
People use historical inflation calculators for numerous practical applications:
Historians contextualizing monetary values in historical documents
Estate planners adjusting legacy values across generations
Economists analyzing long-term economic trends
Investors evaluating real (inflation-adjusted) returns
Contract negotiators including inflation clauses in long-term agreements
Genealogists understanding ancestral financial circumstances
Students comparing historical prices to modern equivalents
By using an inflation rate calculator USA, you gain perspective that raw numbers alone cannot provide.
Calculating Dollar Value Changes Over Time
Understanding Purchasing Power
Purchasing power represents what your money can actually buy—not just its numerical value. This concept is fundamental to using any calculate past dollar value tool effectively.
When inflation occurs, each dollar buys fewer goods and services. For example, while a movie ticket might have cost $4.00 in 1990, today you might pay $15 or more for the same experience. The dollar's purchasing power has declined.
Conversely, deflation (rare in modern economies) increases purchasing power, allowing each dollar to buy more goods and services. Understanding these fluctuations helps contextualize historical financial decisions and evaluate current economic conditions.
Calculating Value from Past to Present
Converting past values to present-day equivalents represents the most common use of a value of money over time USA calculator. This forward calculation shows how much money you would need today to match the purchasing power of a historical amount.
The calculation uses this basic formula: Present Value = Historical Value × (Current CPI / Historical CPI)
For example, using the adjust for inflation calculator to convert $5,000 from 1950 might show that you would need over $60,000 today to maintain the same purchasing power—revealing the dramatic impact of inflation over seven decades.
Reverse Calculations: Today's Dollars in Past Terms
Sometimes you need to work backward, translating current values into historical equivalents. This reverse calculation helps understand how today's prices compare to historical norms.
For instance, a $35,000 vehicle today might be equivalent to a $7,000 car in 1980—putting modern prices into historical perspective. These reverse calculations can be especially revealing when analyzing housing costs, education expenses, or salary comparisons across generations.
Regional Variations in Historical Inflation
While our historical inflation calculator uses national CPI data, it's important to recognize that inflation rates can vary significantly by region. Housing costs in coastal cities, for example, have typically risen faster than the national average.
Regional inflation differences stem from:
Local economic conditions and industries
Population growth or decline
Geographic constraints on housing supply
Regional policy differences
Local wage trends
These variations mean that national inflation figures may not perfectly reflect your specific location's economic history, though they provide valuable general guidance.
Notable Inflation Periods in U.S. History
The Great Inflation (1970s and Early 1980s)
The 1970s stand as a watershed era in American inflation history. Using a 1970 to 2025 inflation calculator reveals the dramatic impact of this period on purchasing power.
Several factors contributed to this inflationary surge:
Oil price shocks in 1973 and 1979
The end of the gold standard in 1971
Expansionary monetary and fiscal policies
Wage-price spirals as workers demanded higher pay to keep pace with rising costs
Annual inflation rates reached double digits multiple times during this period, peaking at approximately 13.5% in 1980. This prolonged inflation eroded savings, disrupted financial planning, and eventually prompted aggressive monetary tightening under Federal Reserve Chairman Paul Volcker.
Periods of Significant Deflation
While inflation dominates modern economic concerns, America has experienced significant deflationary periods that dramatically increased purchasing power but created other economic challenges.
The Great Depression saw prices fall approximately 24% between 1929 and 1933—making goods cheaper but devastating for debtors whose fixed loan amounts became relatively larger. Other notable deflationary periods include:
The post-Civil War era (1865-1896)
The early 1920s following World War I
Brief deflationary episodes during major recessions
Using a historical inflation calculator to examine these periods reveals how dollar values actually increased, even as economic hardship spread.
Recent Inflation Trends (2000-2025)
The early 21st century has seen generally moderate inflation with several notable exceptions. Using a US inflation calculator by year for this period shows:
Relatively stable inflation averaging 2-3% annually during the 2000s
A brief deflationary period during the 2008 financial crisis
Subdued inflation during the 2010s despite unprecedented monetary stimulus
Sharp inflation increases in the early 2020s following pandemic-related supply chain disruptions and stimulus programs
These recent trends demonstrate how modern monetary policy has generally succeeded in avoiding extreme inflation outcomes, though challenges remain in maintaining price stability during economic shocks.
How Economic Events Impact Inflation Rates
Major economic events leave distinctive fingerprints on inflation data that can be traced using a CPI inflation calculator USA. Understanding these relationships helps contextualize historical inflation patterns:
Wars typically generate inflation through increased government spending and resource constraints
Recessions often reduce inflation pressure as spending decreases
Supply shocks (like oil crises) can cause sudden inflation spikes
Technological innovations generally exert downward pressure on prices
Monetary policy changes directly influence inflation through interest rate adjustments
These connections between events and inflation rates provide valuable context when using historical inflation calculators to understand economic history.
Practical Applications of Inflation Data
Personal Financial Planning with Inflation Adjustment
Incorporating inflation calculations into your financial planning transforms abstract projections into realistic expectations. Using historical inflation calculator data helps you:
Project future retirement needs more accurately
Establish realistic savings goals that account for purchasing power erosion
Evaluate whether investments are truly outpacing inflation
Understand the real cost of future major expenses like education or healthcare
For example, if you need $50,000 annually for retirement and expect 3% average inflation, you'll need nearly $90,000 annually in 25 years to maintain the same standard of living—a crucial insight for adequate planning.
Business Applications for Historical Inflation Data
Businesses rely on inflation data for countless strategic decisions. Using a dollar value over time calculator helps companies:
Develop accurate long-term pricing strategies
Calculate real growth rates adjusted for inflation
Value assets purchased in different time periods
Structure compensation packages that maintain purchasing power
Design contracts with appropriate inflation adjustment clauses
Historical inflation trends also provide context for forecasting future cost increases, helping businesses prepare for various economic scenarios.
Investment Strategy and Inflation Considerations
Savvy investors use inflation calculators to evaluate investment performance in real terms rather than nominal returns. This perspective reveals:
Whether investments are truly preserving purchasing power
How different asset classes perform during various inflation environments
The real returns of historical investment periods
The impact of inflation-protected securities compared to traditional investments
For example, a seemingly modest 5% investment return during 3% inflation actually represents just 2% real growth—a crucial distinction for long-term investment planning.
Salary and Cost of Living Adjustments
Employers and employees alike benefit from understanding inflation's impact on compensation. Using an adjust for inflation calculator helps:
Determine whether salary increases are keeping pace with living costs
Compare compensation offers across different time periods
Evaluate the real value of historical salary data
Structure fair cost-of-living adjustments in employment contracts
These applications demonstrate how inflation calculations provide practical value for everyday financial decisions, not just academic economic analysis.
Conclusion
As we've explored throughout this guide, understanding inflation and knowing how to use a historical inflation calculator are essential skills in today's economic landscape. The changing value of money over time in the USA isn't just an abstract concept—it has real implications for your savings, investments, retirement planning, and everyday financial decisions.
Remember that $20,000 car your parents bought in 1985? When you use our US inflation calculator by year, you discover that the same vehicle would cost substantially more today. This perspective doesn't just satisfy curiosity—it provides crucial context for financial planning across generations.
The consumer price index calculator serves as more than just a tool for economists. It's a practical resource for anyone looking to understand purchasing power across different eras, adjust contract values for inflation, or evaluate long-term investment performance. By learning how to calculate past dollar value, you gain insights that help you make more informed financial decisions.
What financial questions might you answer using these tools? Perhaps you're wondering how much your starting salary from 1998 would equate to in today's dollars? Or maybe you're trying to understand if that family heirloom has maintained its value relative to inflation? The inflation rate calculator USA provides these answers and more.
As you move forward with your financial journey, we encourage you to regularly incorporate inflation calculations into your planning. Understanding the historical context of prices and the value of money over time gives you a more complete picture of economic reality. Whether you're negotiating a salary, planning for retirement, or simply budgeting for next year, the ability to adjust for inflation puts you ahead of the curve.
What dollar values from your past would you like to translate into today's terms? We invite you to try our historical inflation calculator and discover the fascinating stories that numbers can tell about our economic history.
Discover our comprehensive range of free calculators designed to meet various needs and simplify your everyday calculations. Whether you're managing personal finances, planning a budget, or calculating loans and interest rates, our user-friendly tools are at your fingertips. From basic arithmetic to complex equations, each calculator is tailored to provide accurate results quickly and efficiently.
© 2025. All rights reserved.